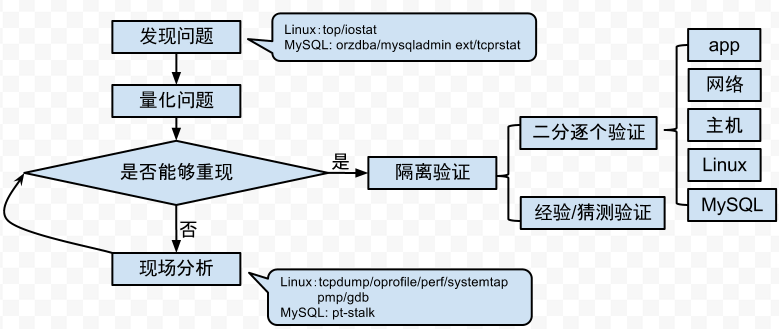
为什么我们的dump很慢
- 现象
- 原来只要8分钟,为什么今天30分钟?
- select * from a_a_0000; 300万数据 1.0GB
量化问题
- slow_ana.pl -f slow.ana.log.Fri
 host         avg  max  min
rd007002.idc 687 2064.1 164
rd007003.idc 162 268.70 146
rd007004.idc 353 948.52 143
rd007005.idc 440 1314.9 146
rd007006.idc 392 1137.5 143
rd007007.idc 559 1728.9 145
rd007008.idc 617 1858.9 151
rd007009.idc 482 1479.8 143
rd007010.idc 568 1782.1 147
rd007012.idc 616 1962.9 157
rd007013.idc 598 1937.5 149
rd007014.idc 781 2203.1 230
rd007015.idc 817 2602.3 144
rd007016.idc 830 2613.7 148
rd007017.idc 774 2484.2 144
rd007018.idc 686 2191.8 154
猜测原因
- 无法精确定位/无法直接操作在线库
- 猜测
- app? 网络? MySQL Linux? 主机/Flashcache 调度问题?
部署监控 尝试重现
- 30秒一次:[MySQL问题?]
- show full processlist\G
- show innodb status\G
- show global status
- tcpdump收集当时的网络数据[网络问题?]
- dba_ping.sh -d 10.246.2.19 -d 10.246.2.45[网络问题?]
过程分析
- show full processlist
- 大量SQL都处于Sending data状态
- The thread is reading and processing rows for a SELECT statement
- 不是网络或者dump端问题
- [实验] client端存储慢:
- MySQL处于Writing to net状态: The server is writing a packet to the network.
过程分析tcpdump
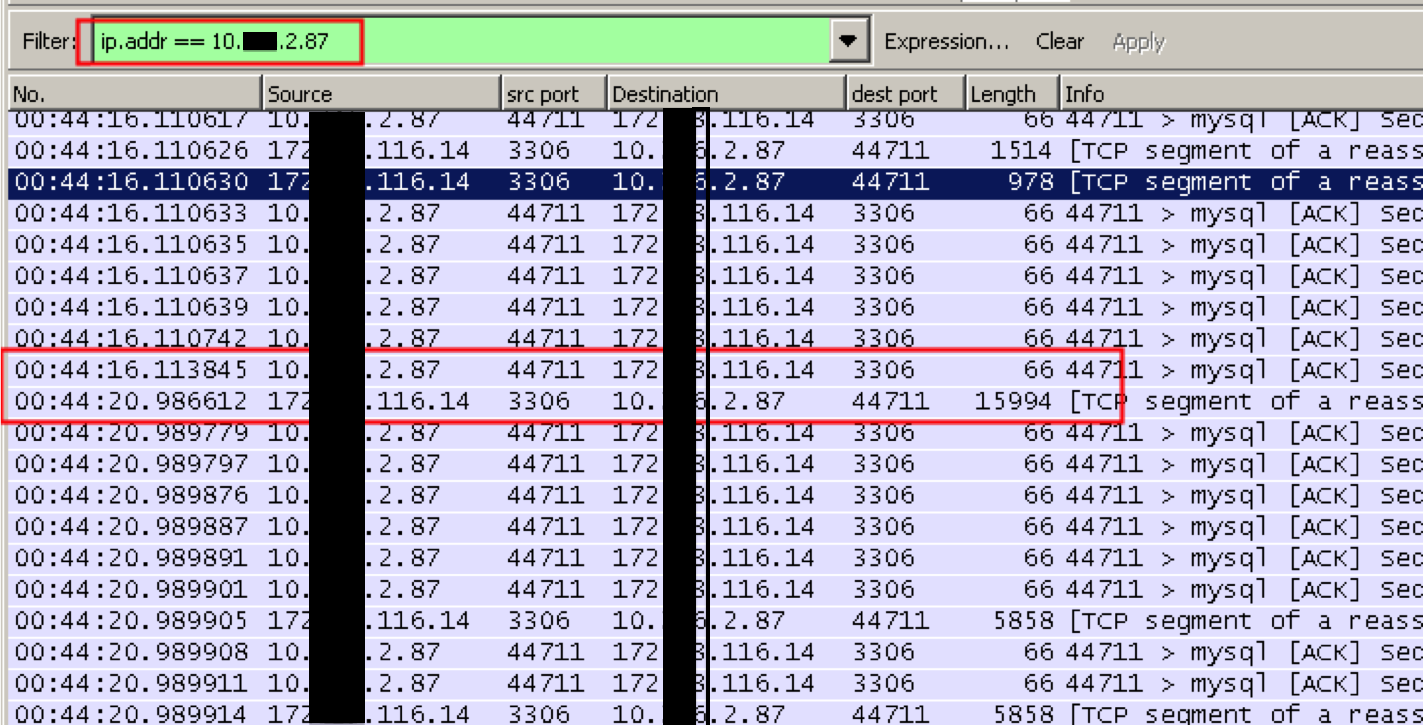
- ACK非常快
- 发包间隔很长!!!
重现问题
- 低峰时间段模拟dump
- 实用gdb/oprofile/pmp分析现场
GDB(1)
#0  0x00000037c340ab99 in pthread_cond_wait@@GLIBC_2.3.2
#1  0x00002aaab307e9a5 in os_event_wait_low
#2  0x00002aaab30cb075 in sync_array_wait_event
#3  0x00002aaab30cbf12 in mutex_spin_wait
#4  0x00002aaab30185c7 in buf_page_set_accessed_make_young
#5  0x00002aaab3018679 in buf_page_optimistic_get
#6  0x00002aaab300d3e2 in btr_pcur_restore_position_func
#7  0x00002aaab30b4bc7 in sel_restore_position_for_mysql
#8  0x00002aaab30b8432 in row_search_for_mysql
#11 0x000000000061b756 in sub_select
#12 0x000000000062e0ad in do_select
GDB(2)
#0  0x00002aaab3020481 in buf_LRU_search_and_free_block
#1  0x00002aaab302094e in buf_LRU_get_free_block
#2  0x00002aaab301643e in buf_page_init_for_read
#3  0x00002aaab30214d5 in buf_read_page_low
#4  0x00002aaab3021ec1 in buf_read_ahead_linear
#5  0x00002aaab3018d0e in buf_page_get_gen
#6  0x00002aaab300c612 in btr_pcur_move_to_next_page
#7  0x00002aaab30b8d6a in row_search_for_mysql
#8  0x00002aaab305133c in ha_innodb::general_fetch
#9  0x00000000006a7d97 in rr_sequential
#10 0x000000000061b756 in sub_select
#11 0x000000000062e0ad in do_select
#12 0x000000000063b0d4 in JOIN::exec
oprofile
CPU: CPU with timer interrupt, speed 0 MHz (estimated)
Profiling through timer interrupt
samples  %        image name               symbol name
34043    72.3826  ha_innodb_plugin.so.0.0.0 buf_LRU_search_and_free_block
4837     10.2845  ha_innodb_plugin.so.0.0.0 ut_delay
2959      6.2915  ha_innodb_plugin.so.0.0.0 buf_LRU_free_block
1283      2.7279  libpthread-2.5.so         pthread_mutex_lock
851       1.8094  ha_innodb_plugin.so.0.0.0 buf_page_is_corrupted
546       1.1609  ha_innodb_plugin.so.0.0.0 mutex_spin_wait
315       0.6698  libc-2.5.so               memcpy
239       0.5082  ha_innodb_plugin.so.0.0.0 buf_calc_page_new_checksum
179       0.3806  ha_innodb_plugin.so.0.0.0 rec_get_offsets_func
162       0.3444  libpthread-2.5.so         pthread_mutex_unlock
107       0.2275  ha_innodb_plugin.so.0.0.0 row_search_for_mysql
98        0.2084  ha_innodb_plugin.so.0.0.0 row_sel_store_mysql_rec
原因小结
- LRU链表上有太多的search and free
- old list中有大量dirty page
- dump所需页面远大于可以使用的页面
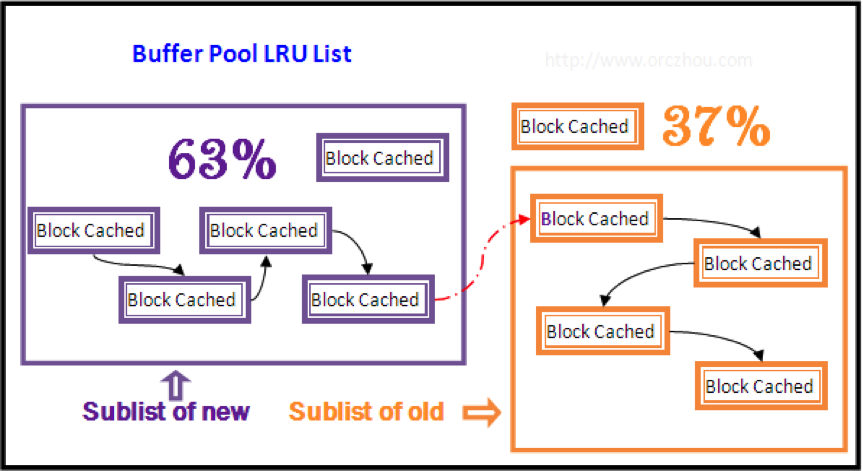
修改策略
- 通过预热减少Buffer Pool中的脏页
- 修改innodb_old_blocks_time = 1000 减少页面从old sublist移到new sublist
- 开始dump时通过设置innodb_max_dirty_pages_pct 减少脏页的数量
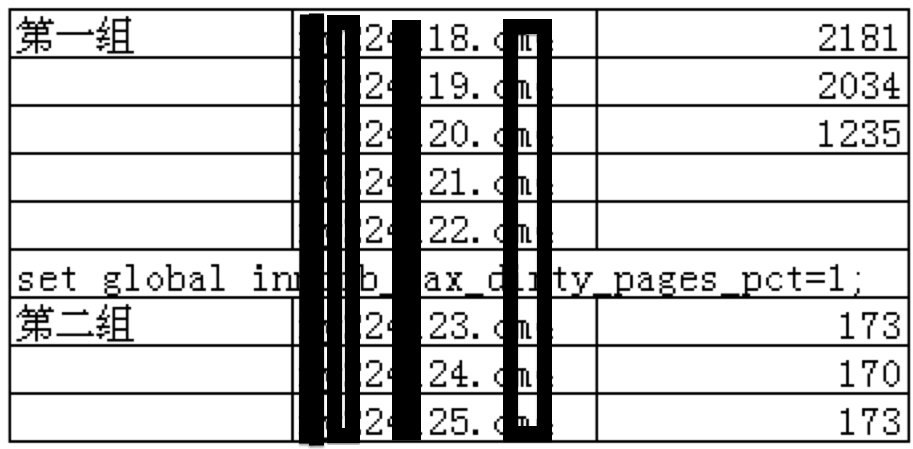
有效性验证
- innodb_max_dirty_pages_pct验证
- innodb_old_blocks_time = 1000验证有效
建议规范
SET GLOBAL innodb_old_blocks_time = 1000;

开始dump

SET GLOBAL innodb_old_blocks_time = 0;
结果
- slow_ana.pl -f slow.ana.log.Fri
host         avg  max  min
rd007002.idc 687 2064.1 164
rd007003.idc 162 268.70 146
rd007004.idc 353 948.52 143
rd007005.idc 440 1314.9 146
rd007006.idc 392 1137.5 143
rd007007.idc 559 1728.9 145
rd007008.idc 617 1858.9 151
rd007009.idc 482 1479.8 143
rd007010.idc 568 1782.1 147
rd007012.idc 616 1962.9 157
rd007013.idc 598 1937.5 149
rd007014.idc 781 2203.1 230
rd007015.idc 817 2602.3 144
rd007016.idc 830 2613.7 148
rd007017.idc 774 2484.2 144
rd007018.idc 686 2191.8 154
==>
 host        avg max min
rd007002.idc 206 260 158
rd007003.idc 201 248 161
rd007004.idc 206 262 170
rd007005.idc 204 257 169
rd007006.idc 204 257 166
rd007007.idc 206 278 161
rd007008.idc 206 250 162
rd007009.idc 205 258 162
rd007010.idc 208 271 163
rd007012.idc 209 267 154
rd007013.idc 206 280 154
rd007014.idc 207 278 155
rd007015.idc 203 287 154
rd007016.idc 205 273 153
rd007017.idc 203 276 152
rd007018.idc 188 247 108
工具说明
- oprofile 是一个“全局”的抽样统计
- perf top or… sth else
- gdb 是一个“现场快照”
- tcpdump 是一个“流量录像”
oprofile cheatsheet
sudo yum install binutils-devel
./configure --with-kernel-support && make
make install
sudo opcontrol --deinit
sudo modprobe oprofile timer=1
$dmesg|grep oprofile|tail -n 1
  (oprofile: using timer interrupt.)
sudo opcontrol --reset
sudo opcontrol --separate=lib --no-vmlinux \
--start --image=/u01/mysql/libexec/mysqld
sudo opcontrol --dump
sudo opcontrol --shutdown
opreport -l /u01/mysql/libexec/mysqld
gdb+pmp cheatsheet
sudo sh -c 'gdb -ex "set pagination 0" –ex \
"thread apply all bt" --batch \
-p $(pidof mysqld) > bt.log'


sudo sh -c 'gdb -ex "set pagination 0" -ex \
"thread apply all bt full" --batch \
-p $(pidof mysqld) > bt.log.full'

tcpdump cheatsheet
nohup tcpdump -n -nn -tttt -i bond0 \
-s 65535 'port 3306' -w tcpdump.ret -C 100 &
- 剩下的交给wireshark

流程
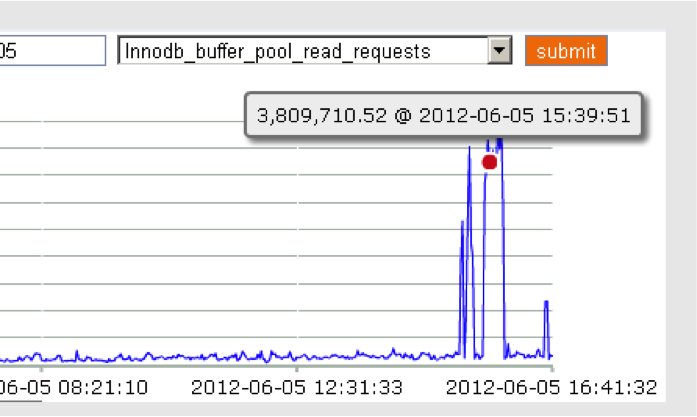
案例2: 数据库是不是有波动?
- 告警增多,应用大量超时失败
- 持续时间较短,不定时出现
数据库是否有问题?
确定这是一个数据库问题
$tcprstat -l $ip_addr -t $interval -n $count
RT/us         Time
736    2012-06-05 15:12:11
62195  2012-06-05 15:12:19
822385 2012-06-05 15:12:27
758795 2012-06-05 15:12:35
263320 2012-06-05 15:12:44
732564 2012-06-05 15:12:52
757521 2012-06-05 15:13:00
677436 2012-06-05 15:13:08
75488  2012-06-05 15:13:16
3725   2012-06-05 15:13:24
3042   2012-06-05 15:13:32
2393   2012-06-05 15:13:41
2590   2012-06-05 15:13:49
Key Performance Indication
- KPIs
- com_select/insert/update/delete
- Innodb_rows_read/update/delete/insert
- Innodb_logical_read/physical_read
慢日志
- 检查慢日志(80%)
- pt-query-digest mysqldumpslow
- tbdba-slow-picker.pl 按SQL开始时间处理
- cheatsheet
mysqldumpslow -a -s at slow.log.old > slow.3.dat
pt-query-digest --filter \
'(\$event->{user}) =~ m/^(?!dw|search|root|dump|slave)/'\
 --report-format=profile,query_report
./tbdba-slow-picker.pl -z 8 \
-s “2012-06-04 16:52:48” \
-u “2012-06-04 16:53:04” \
-f  /u01/mysql/log/slow.log > slow.hit.log
pt-stalk cheatsheet
- 使用pt-stalk精准的抓住现场:
#!/bin/bash
MYSQL_HOME=/u01/mysql
PATH=$MYSQL_HOME/bin:$PATH:$HOME/bin:/home/mysql/bin
export MYSQL_HOME
export PATH
pt-stalk --collect-tcpdump --function status \
--variable Threads_connected --threshold 2500 \
--daemonize -- --user=root
发现的各种问题
- 应用异常
- SQL效率问题
- 错误的执行计划问题
索引覆盖扫描
- 索引覆盖扫描 vs 回表
select
  count(*)
from
  t1
     force index(IND_DATAIDGMT)
where
  is_main = 1 and
  (
    the_type=100 or
    the_type=200 or
    the_type=300 or
    the_type=500
   ) and
  data_id=631389273 and
  status=0 and
  gmt_modified >= '2012-03-28' and
  gmt_modified <= '2012-03-29';
原索引:
KEY `IND_DATAIDGMT` (
  `DATA_ID`,
  `GMT_MODIFIED`
);
新索引:
KEY`IND_DATAIDGMT` (
  `DATA_ID`,
  `GMT_MODIFIED`,
  `the_type`,
  `status`,
  `is_main`);
索引覆盖扫描 vs 回表
- 以逻辑读评估
- 性能相差约25倍 389678/14529
相同的SQL,当覆盖索引和非覆盖索引时候的性能(以逻辑读评估):
|No. | Not Cover | Cover all |
|1   | 578186    | 14529     |
|2   | 444781    | 14529     |
|3   | 362091    | 14529     |
|4   | 358816    | 14529     |
|5   | 358816    | 14529     |
|6   | 358816    | 14529     |
|7   | 358816    | 14529     |
|8   | 358816    | 14529     |
|9   | 358823    | 14529     |
|10  | 358816    | 14529     |
|AVG | 389678    | 14529     |
错误的执行计划
- 表/索引结构
- 意外的执行计划
- 为什么不走更长key length的range?
CREATE TABLE `users` (
  `id` int(11) NOT NULL AUTO_INCREMENT,
  `uid` int(11) NOT NULL,
  `l_date` datetime NOT NULL,
  `data` varchar(32) DEFAULT NULL,
  PRIMARY KEY (`id`),
  KEY `ind_uidldate` (`uid`,`l_date`)
) ENGINE=InnoDB DEFAULT CHARSET=gbk
explain select * from users
where uid=9527 and l_date >= '2012-12-10 10:13:17' order by l_date limit 0,10;
+----+-------------+-------+------+---------------+--------------+---------+-------+------+-------------+
| id | select_type | table | type | possible_keys | key          | key_len | ref   | rows | Extra       |
+----+-------------+-------+------+---------------+--------------+---------+-------+------+-------------+
|  1 | SIMPLE      | users | ref  | ind_uidldate  | ind_uidldate | 4       | const |  473 | Using where |
+----+-------------+-------+------+---------------+--------------+---------+-------+------+-------------+
当前场景,原因分析
- 小记录,range选择度大于17%,放弃
- 小记录,ref选择度大于93%,放弃
- 问题背景
- 选择度分析:参考
- 问题的历史:bug#12113 Indexes in MySQL@Performance Blog
- 版本:5.1/5.5/5.6
如何解决
- force index: 放弃全表
- patch:统一range与ref的代价评估
小结
- 关注慢日志
- 理解Explain
explain select * from users where uid=9527 and l_date >= '2012-12-10 10:13:17' order by l_date limit 0,10\G
*************************** 1. row ***************************
           id: 1
  select_type: SIMPLE
        table: users
         type: ref
possible_keys: ind_uidldate
          key: ind_uidldate
      key_len: 4
          ref: const
         rows: 885
        Extra: Using where
        Extra: Using where
最后
- 正确的流程
- 合适的工具
- MySQL Status: com_sel/upd/del/ins innodb_row_sel/upd/del/ins...
- Linux: top/iostat/mpstat tcpdump/oprofile/gdb
- SQL: Explain pt-toolkit mysqldumpslow

Q & A